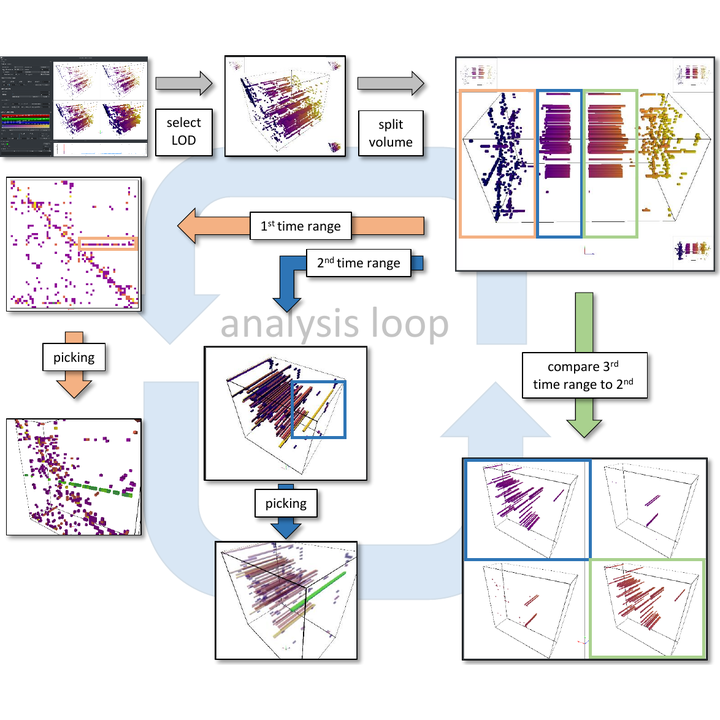
 Analyzing a software call graph using our visualization system.
Abstract
We present an approach for interactively analyzing large dynamic graphs consisting of several thousand time steps with a particular focus on temporal aspects. we employ a static representation of the time-varying graph based on the concept of space-time cubes, i.e., we create a volumetric representation of the graph by stacking the adjacency matrices of each of its time steps. To achieve an efficient analysis of complex data, we discuss three classes of analytics methods of particular importance in this context: data views, aggregation and filtering, and comparison. For these classes, we present a GPU-based implementation of respective analysis methods that enable the interactive analysis of large graphs. We demonstrate the utility as well as the scalability of our approach by presenting application examples for analyzing different time-varying data sets.
Valentin Bruder
Doctoral Researcher
My research interests include scientific visualization, performance modeling/prediction, and GPGPU.